Google OR-Tools - Part 2
Here, i am back again with a new blog post on Google OR-Tools. Today, I am going to discuss yet another problem statement and a member in optimization algorithms i.e. Constraint Programming.
Introduction
Constraint Programming is a technique used to solve combinatorial problems and is widely used in various fields of study such as AI, Computer science and operational research. In this technique we try to find some solution to a combinatorial problem or tend to optimize a solution restricted by some constraints.
Some examples provided by google include :- N-Queens problem, Cryptarithmetic problem etc.
For such problems, OR-Tools included solvers such as The CP-SAT Solver, The original Solver.
Linear Solver and CP-SAT
So, you would be thinking this to be same as the one we studied earlier.
What is the difference between the linear solver and CP-SAT solver?
Linear Solver is focused on optimizing an objective function, given a set of arbitary constraints. Whereas, in CP-SAT we tend to focus on values of variables thet satisfy the constraints rather than optimizing a objective function itself.
What to use when?
If you have a problem statement which can be modeled with linear objective function and linear constraints then you would like to use linear solver such as Glop. Whereas, CP problems are more of checking feasibility or finding all the solutions to a given problem with constraints. It may, or may not have a optimization function. Also, CP-SAT is relatively better in finding all the valid solutions when new set of constraints are added.
Note :- When you use CP-SAT to find an optimal solution to a objective function it will put all the feasible solutions in the objective function one by one to find the best amongst them.
Problem formulation
To understand the concept of constraint programming let’s formulate a problem. For this, I am going to solve a very famous problem in the field of computer science known as Graph Coloring problem. In a Graph coloring problem, we are provided with a set of nodes having connections between them to form a graph. Our job is to fill it’s nodes with N number of colors such that their is no two node having a edge between them and are of same color.
Sounds easy right, for small graphs having 10-15 nodes it might be an easy task but for graphs with 100 or 1000 nodes it becomes really difficult. In Sport programming, people use backtracking to solve these kind of problem. They tend to generate a data structure such as a tree, Where each node has a candidate solution arranged in hierarchical order, then use a technique called backtracking to solve it.
Backtracking is nothing but trying to solve the problem with following a path assigning values which shall satisfy the constraint and in case it gets wrong, then moving back up till the place where it seems right.
CP-SAT solver moves in a similar way. it assigns values to variables in a way that it shall not violate the constraint and in case it gets it wrong it moves back to the previously assigned variable. Seems similar, but the twist here is that CP-SAT does not require you to write all the code that involve backtracking.
To formulate such a problem we need to identify three things :-
- Variables :- These are the values we need to obtain as solution.
- Domain :- we need to define domain that is the range of values that each variable can take. In other words, these are called bounds.
- Constraints :- These are the inequalities that you need to satisfy while assigning values to a variable. A solution must obey all these inequalities.
Let’s formulate these for the problem statement above :-
- Variables :- Here variables are the colors we can assign to each node. So, each node shall have a variable for itself containing a value that indicates it color.
- Domain :- Domain is the set of colors from which we can assign a color to node in the graph. Here, we will take integers starting from 0 to K-1 where K is the number of colors, and each integer denotes a color.
- Constarints :- For the problem above, No two nodes having a edge between them can have the same color. So, we will define constraint for each edge in the graph. For example, if there exist a edge from node N1 to node N2 then the value of N1 can not be equal to value of N2.
Installation
For the reference to installation of or-tools, it is best to follow the guidelines mentioned at here.
We will be using networkx for plotting graphs. Follow the installation guidelines mentined at here.
Code
from ortools.sat.python import cp_model
import matplotlib.pyplot as plt
import networkx as nx
# Define a class for solution printing inheriting the CpSolverSolutionCallback
class SolutionPrinter(cp_model.CpSolverSolutionCallback):
"""Print intermediate solutions."""
def __init__(self, variables, limit):
cp_model.CpSolverSolutionCallback.__init__(self)
self.__variables = variables
self.__solution_count = 0
self.__solution_limit = limit
self.colors = ["red", "blue", "green"]
self.node_colors = []
# This is a callback function which is called when a solution is found.
def OnSolutionCallback(self):
self.__solution_count += 1
for v in self.__variables:
print('{} = {}'.format(v, self.colors[self.Value(v)]), end = '\n')
self.node_colors.append(self.colors[self.Value(v)])
print()
if self.__solution_count >= self.__solution_limit:
print('Stop search after {} solutions'.format(self.__solution_limit))
self.StopSearch()
def SolutionCount(self):
return self.__solution_count, self.node_colors
# A function to solve the graph coloring problem
def graph_coloring(num_nodes, connections, k, num_solutions=2):
# Instantiate the CpModel
model = cp_model.CpModel()
# Create a variable ranging from 0 to k for each node.
nodes = [model.NewIntVar(0, k-1, 'x%i' %i) for i in range(num_nodes)]
# Add a constraint (i.e value of node A != value of node B) for each edge.
for i, conn in enumerate(connections):
model.Add(nodes[conn[0]] != nodes[conn[1]])
# Instantiate a Cp solver
solver = cp_model.CpSolver()
# Instantiate a callback function to print solution
solution_printer = SolutionPrinter(nodes, num_solutions)
# Search for all soltuions
status = solver.SearchForAllSolutions(model, solution_printer)
count, colors = solution_printer.SolutionCount()
print("Solution found : %i" % count)
# Return the color values
return colors
# Define number of nodes in the graph
num_nodes = 10
# Set number of colors as domain
domain = 3
# Add a connection for each edge.
connections = [
(0, 1),
(1, 2),
(2, 3),
(3, 4),
(0, 4),
(1, 5),
(0, 6),
(2, 7),
(3, 8),
(4, 9),
(5, 9),
(5, 8),
(6, 7),
(6, 8),
(7, 9)
]
# Define the number of solutions required.
num_solutions = 1
# plot a raw graph
g1 = nx.Graph()
for conn in connections:
g1.add_edge(conn[0], conn[1], color="black")
plt.subplot(121)
nx.draw(g1, with_labels=True, font_weight='bold')
plt.savefig("raw.png")
# call the graph coloring function to solve the graph for given colors.
colors = graph_coloring(num_nodes, connections, domain, num_solutions)
# Plot a processed graph.
plt.subplot(122)
assign_colors = []
for node in g1.nodes():
assign_colors.append(colors[node])
nx.draw(g1,node_color = assign_colors, with_labels=True, font_weight='bold')
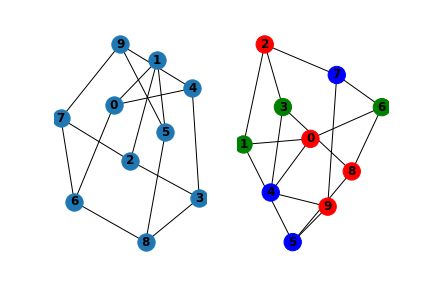
plt.savefig("processed.png")Output
x0 = red
x1 = green
x2 = red
x3 = green
x4 = blue
x5 = blue
x6 = green
x7 = blue
x8 = red
x9 = red

Stop search after 1 solutions
Solution found : 1
and a picture,
For code you can refer to my colab notebook on github
I hope you understood how a constraint programming problem is formulated and solved with this amazing tool provided by google. For more info you can always refer to documentation and tutorials by google.
Conclusion
Today, we learnt how to formulate a constraint programming problem and solve it using Google OR-Tools. Thanks for a reading. I’ll be continuing on more problems that are solved by Google OR-Tools. So, if you are interested see you around. Bye!